Loading data
Community Energy LondonPotential Mapv2 |

This map has been developed to help community energy groups find promising development opportunities and for policy makers to visually explore the potential of community energy in London.
Data from the London Solar Opportunity Map, London Heat Map and the London Building Stock Model have been matched to community building types and the data can be explored by administrative area (borough, constituency, ward) or for London as a whole.
You can find full instructions and more information about the data by clicking the buttons above.
Check out our website if you would like to learn more about community energy. If you feel inspired to get involved with a group or maybe even start your own, please get in touch and see the resources on our website.
You can also find our map of current community energy projects in London here.
Built by Tim Minshall
Contains OS data © Crown copyright and database right 2023
- You are granted a non-exclusive, royalty free revocable licence solely to view the licensed data for non-commercial purposes for the period during which the Greater London Authority and Community Energy London make it available;
- You are not permitted to copy, sub-license, distribute, sell or otherwise make available the licensed data to third parties in any form; and
- Third party rights to enforce the terms of this licence shall be reserved to OS.
This tool is designed to help community energy groups find promising development opportunities and for policy makers to visually explore the potential of community energy in London.
Data from the London Solar Opportunity Map, London Heat Map and London Building Stock Model are provided to help users find and rank potential community buildings for further investigation. The values of solar potential and heat demand should only be used for this purpose and it should be noted that a full feasibility study and structural survery will be required to develop any project.
It should also be noted that we do not have a dataset of buildings already developed and so this will be one of the first things to investigate after identifying buildings of interest.
Please find disclaimers related to the datasets used to create this map here: London Solar Opportunity Map, London Heat Map, London Building Stock Model and Ordnance Survey AddressBase dataset.
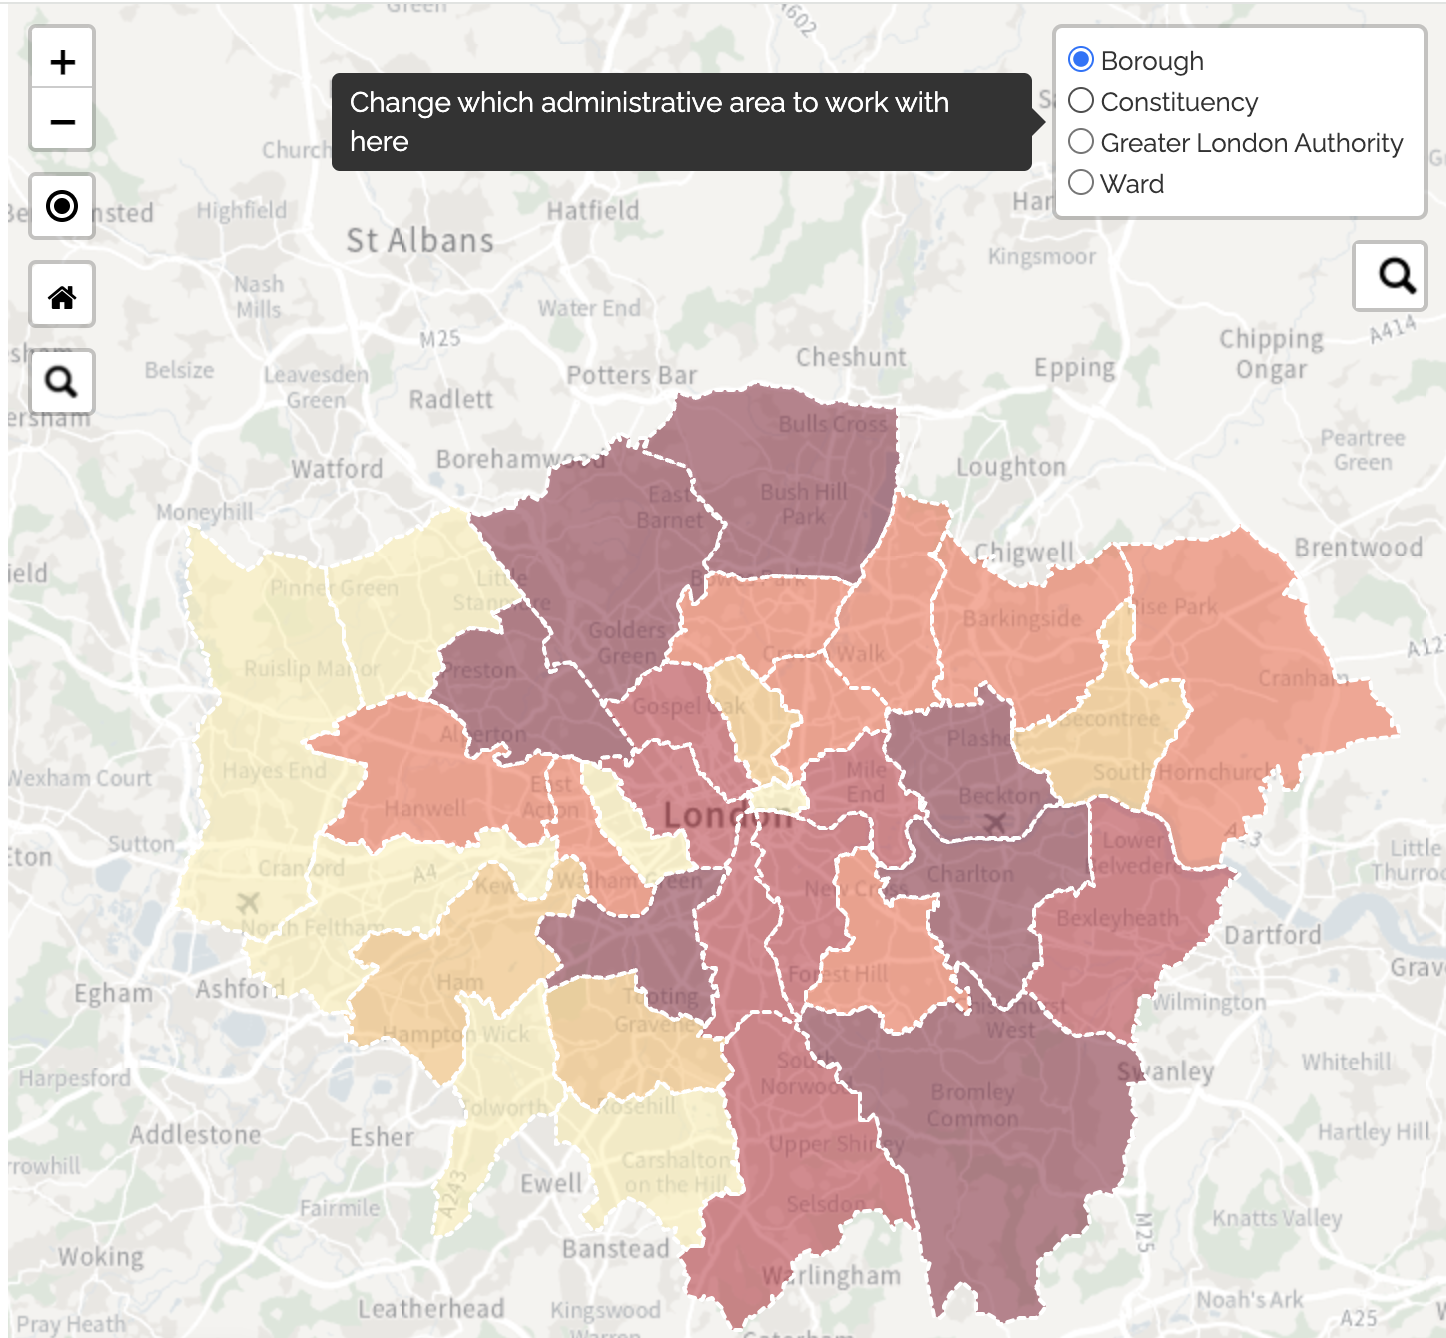
- Choose an administrative area
Select which type administrative area (borough, constituency, ward or the greater london area) you would like to work with by hovering over the layer control icon in the top right corner of the map and selecting your choice. Areas will appear on the map coloured by the total solar potential of the community buildings. - Find your area of interest
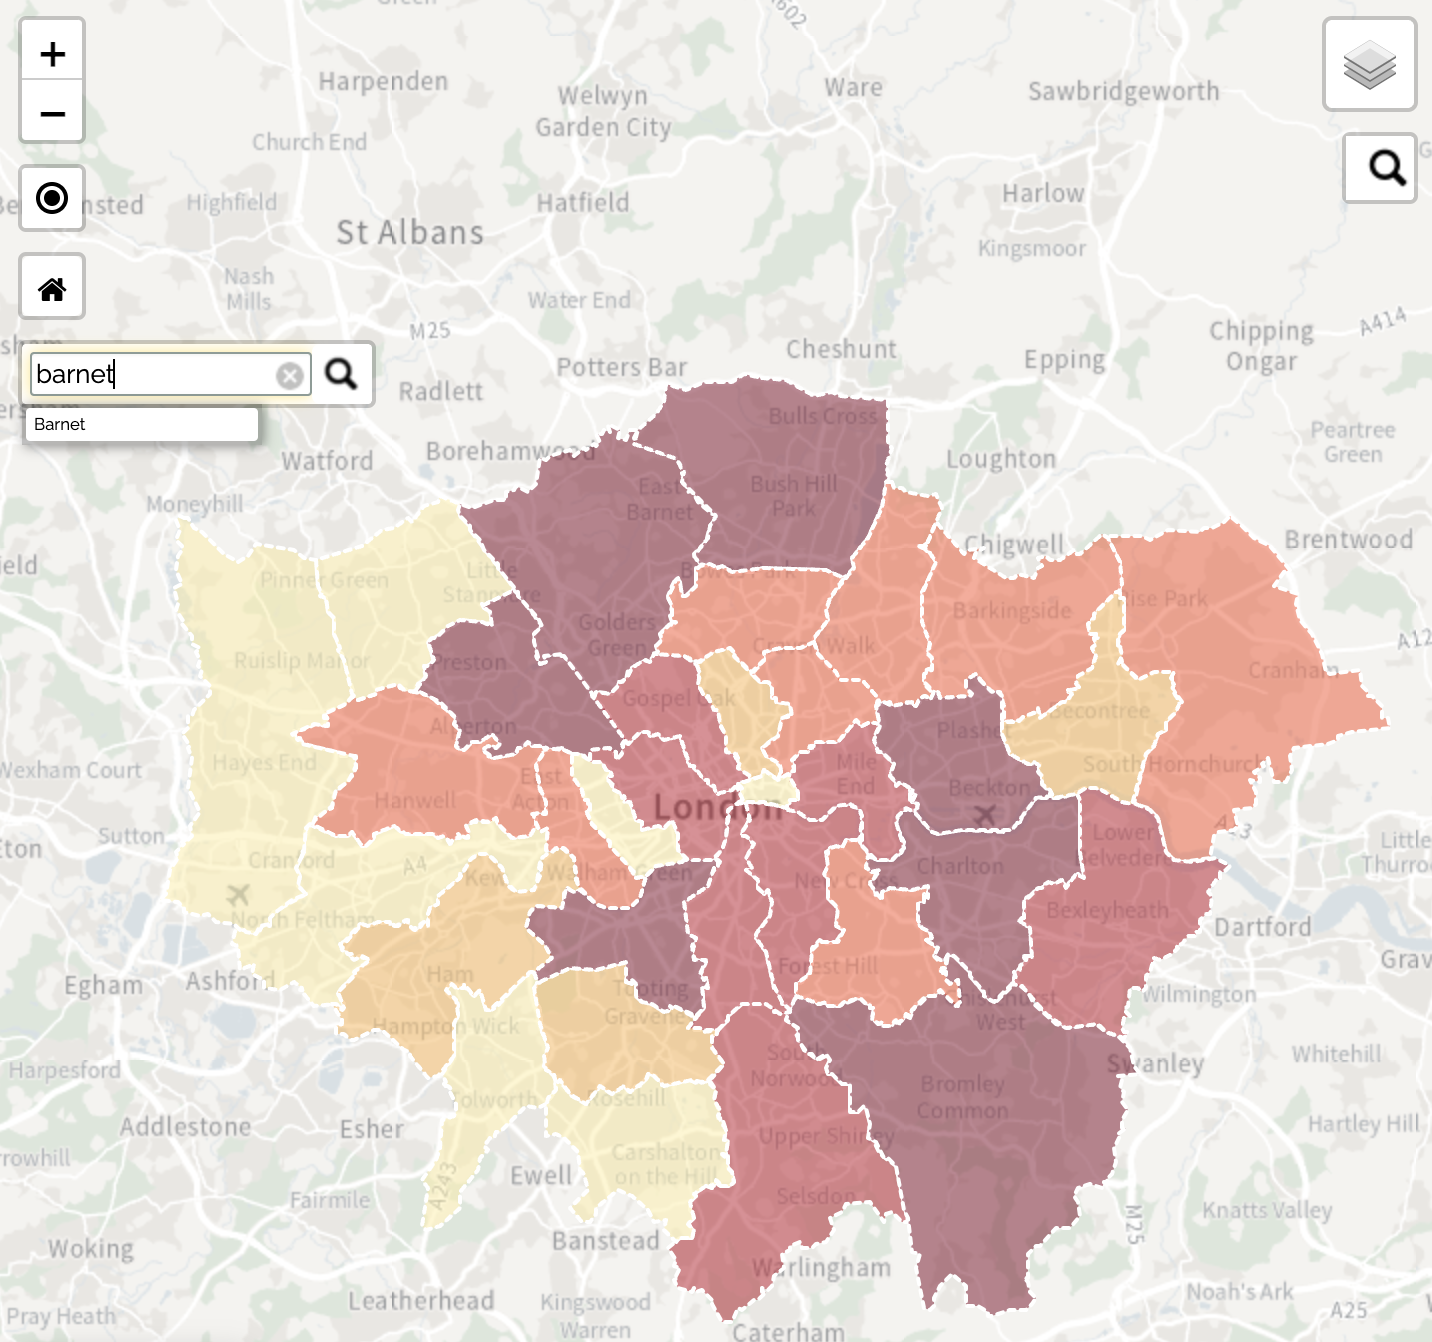
If you know where it is then you can simply click on it but if not, you can search using the search feature on the left of the map. - Explore the data
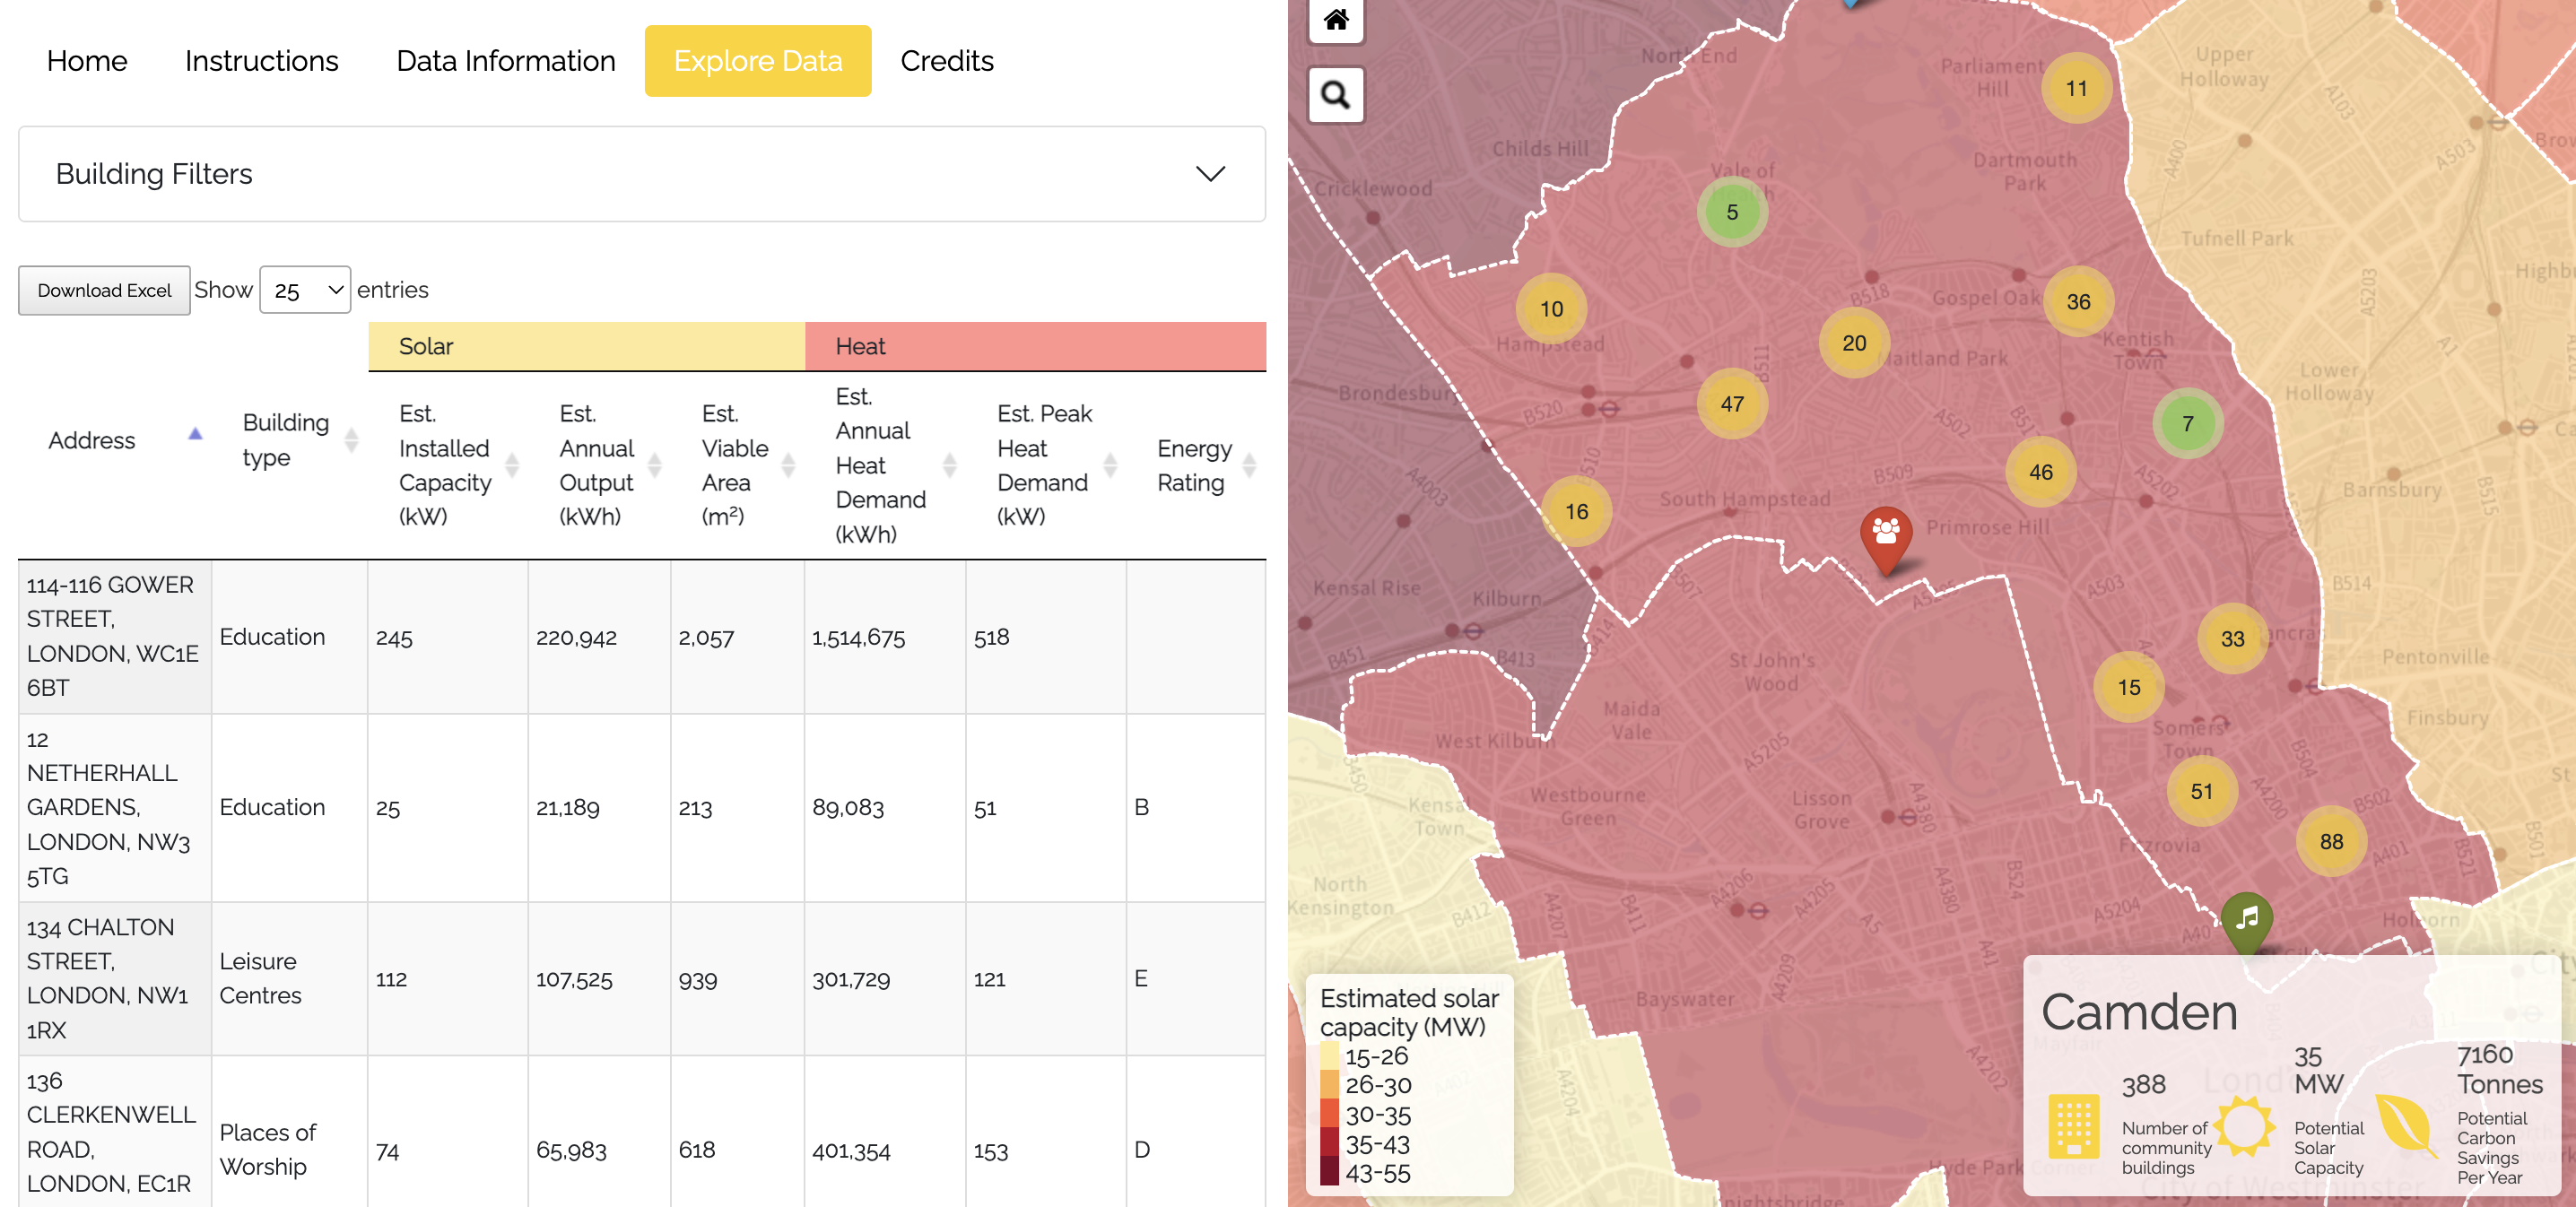
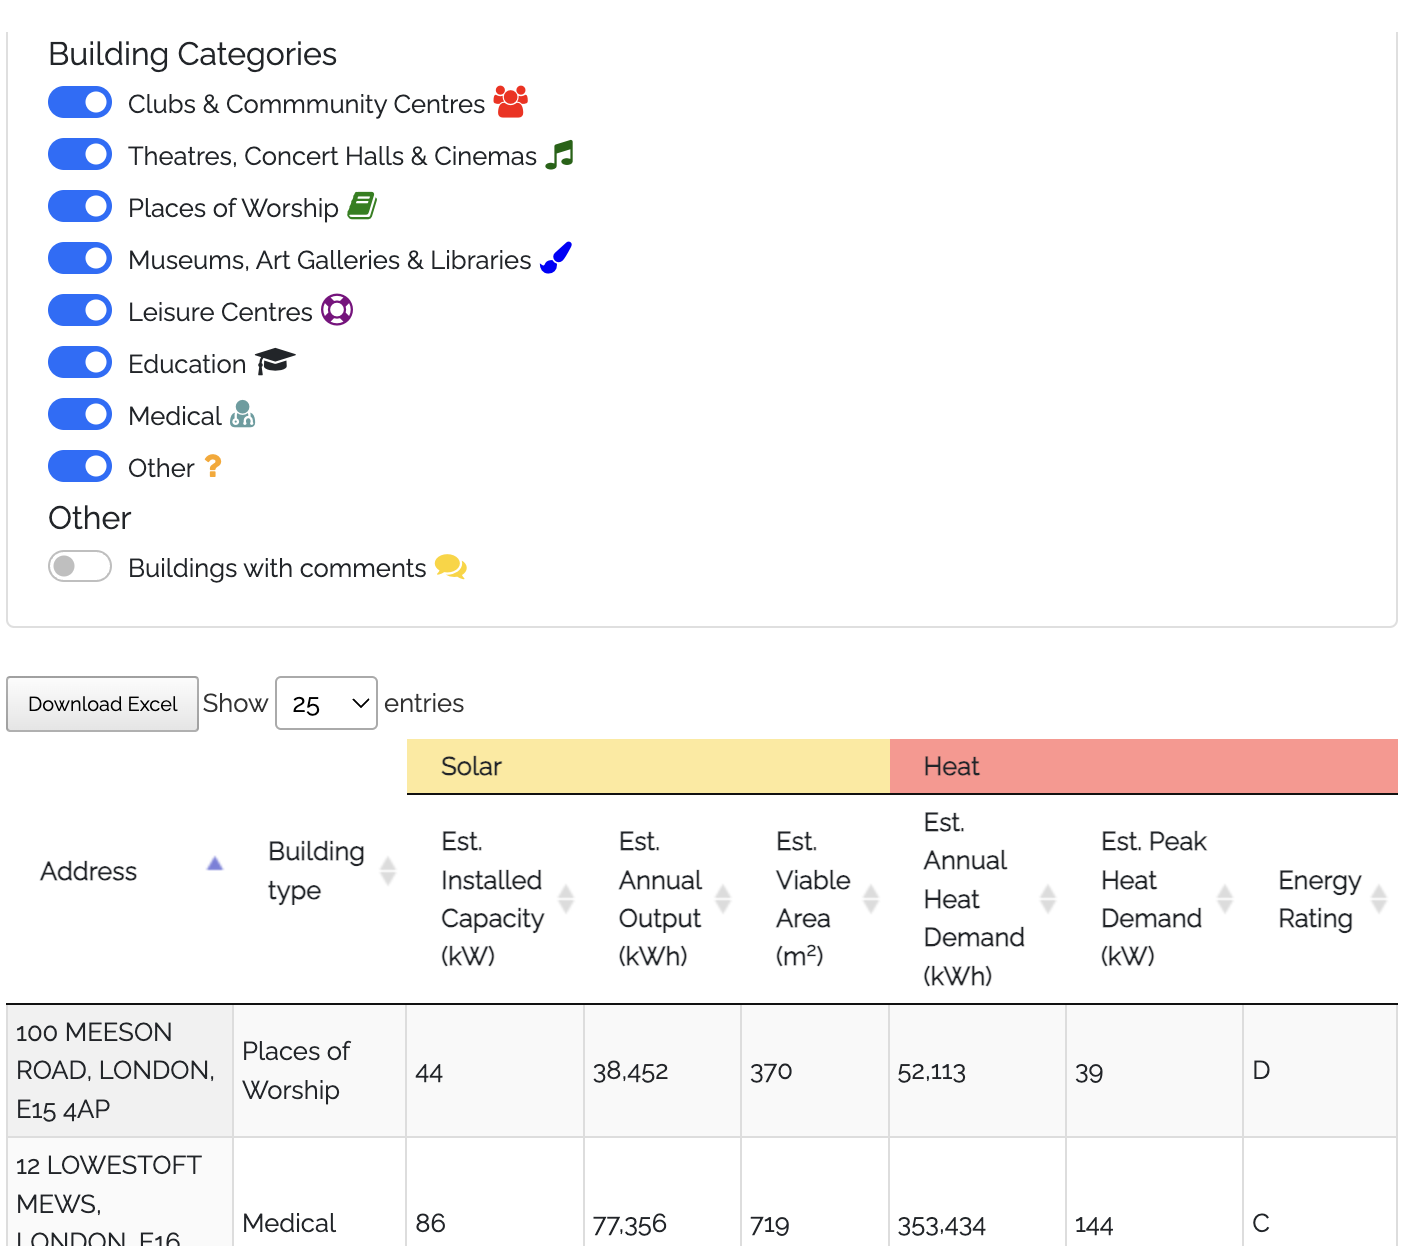
Building data will appear for you to explore in this panel after selecting an area. Note that the buildings will be sorted in decreasing order by estimated solar annual output to highlight the most promising potential solar developments but you can sort by clicking on column headings. You can also hide specific categories of buildings by clicking the buttons above the table.
Click on a row in the table to zoom to the building on the map. Some statistics will also appear in the bottom right corner of the map to help understand the solar potential of the selected area.
- Investigate individual buildings
Buildings will appear as clusters of markers (the number in each cluster tells you how many buildings are in it). Zoom in or click on a cluster to reveal the markers for each building. Click on a building of interest to bring up a popup with information about the building, as well as solar and heat potential data. Note that the colour and icon of each marker represents the building category (see the 'Data Information' tab for more details). - Collaborate with other community energy groupsnew
Building popups now have an button which allows you to open a page for that building where you can add comments or feasibility studies. Use this page to share your findings with other groups.

Data from the London Solar Opportunity Map, London Heat Map and the London Building Stock Model have been matched to community building types in London. Details of how we have used these datasets can be found below but for full details and disclaimers, please follow the links above.
There may be misisng buildings and all data may not be available for all those which are displayed. This tool includes all data available to us and will be updated when updated data is made available.
The solar, heat and energy efficiency data has been matched to community buildings in London by the Greater London Authority using the Ordnance Survey AddressBase dataset.
Please note that this dataset is not fully complete and so you may not be able to find all community buildings in your area of interest. If that's the case, please get in touch and we will try our best to get them added.
Please also note that, while preparing the data for the map, we had to make sure only one building is shown per address, as sometimes there were multiple addresses per building (all with the same solar potential). We have removed these duplicates but the one address per building left may be confusing, with some addresses including 'First Floor' or potentially only one of many business names within the building. We are working on improving this but for now you may need to ignore the first part of an address.
Each community building is represented as a marker on the map after clicking on an administrative area.
Buildings are categorised into the following groups:
For all solar data, we have assumed the installation of polycrystalline panels with an output ratio of 11.9% covering the whole viable area.
Potential carbon savings are estimated using the above assumption combined with a carbon intensity based on LEGGI (London Energy and Greenhouse Gas Inventory) figure of 0.231 kgCO2e/kWh
Estimated annual heat demand and estimated peak demand data are provided where available. For more information about this data, please check out the London Heat Map, London Datastore and the Centre for Sustainable Energy (CSE) who created the tool..
If you spot any differences with the London Heat Map, it is because we are currently in the process of updating this dataset.
Please note these values are a bit outdated and so it is recommended to source the latest EPC. If an energy rating is known for a specific building, clicking it will take you to a search for the latest EPCs matching the building post code but you may not be able to find an EPC for the building due to gaps in the data.
We are working on updating EPCs shown on the map.
Want to explore the data more?
Become a Community Energy London member and get full access to the map (besides all the other great benefits)
- Explore data in an interactive table
- Download data in Excel format
- Filter data in the table and on the map
- new Collaborate with other community energy groups using the commenting system to share investigations into potential sites
- new Gain access to solar feasibility studies submitted by other community energy groups
Once you become a member, we will send you a login for your group
The development of this tool would not have been possible without the huge help of the Greater London Authority (GLA) for providing and advising on all the data used; the UCL Energy Institute for supporting us in using their dataset; and Ordnance Survey for their help navigating data licensing issues.
We would like to thank Greg Shreeve, Matt Thomas, Emma Gray and and Paul Hodgson at the GLA. We would like in particular to thank Ruxanda Profir, Senior Data Analyst at the GLA, without whose help the map would have not been possible.
With thanks to funding from the GLA.